
We have two major new features for you: real-time data directly in the exnaton dashboard and extensive improvements to our web components (“exnaton Molecules”) and the end-customer dashboard.
Both updates provide a more modern user experience, greater transparency, and even easier integration into existing customer portals.
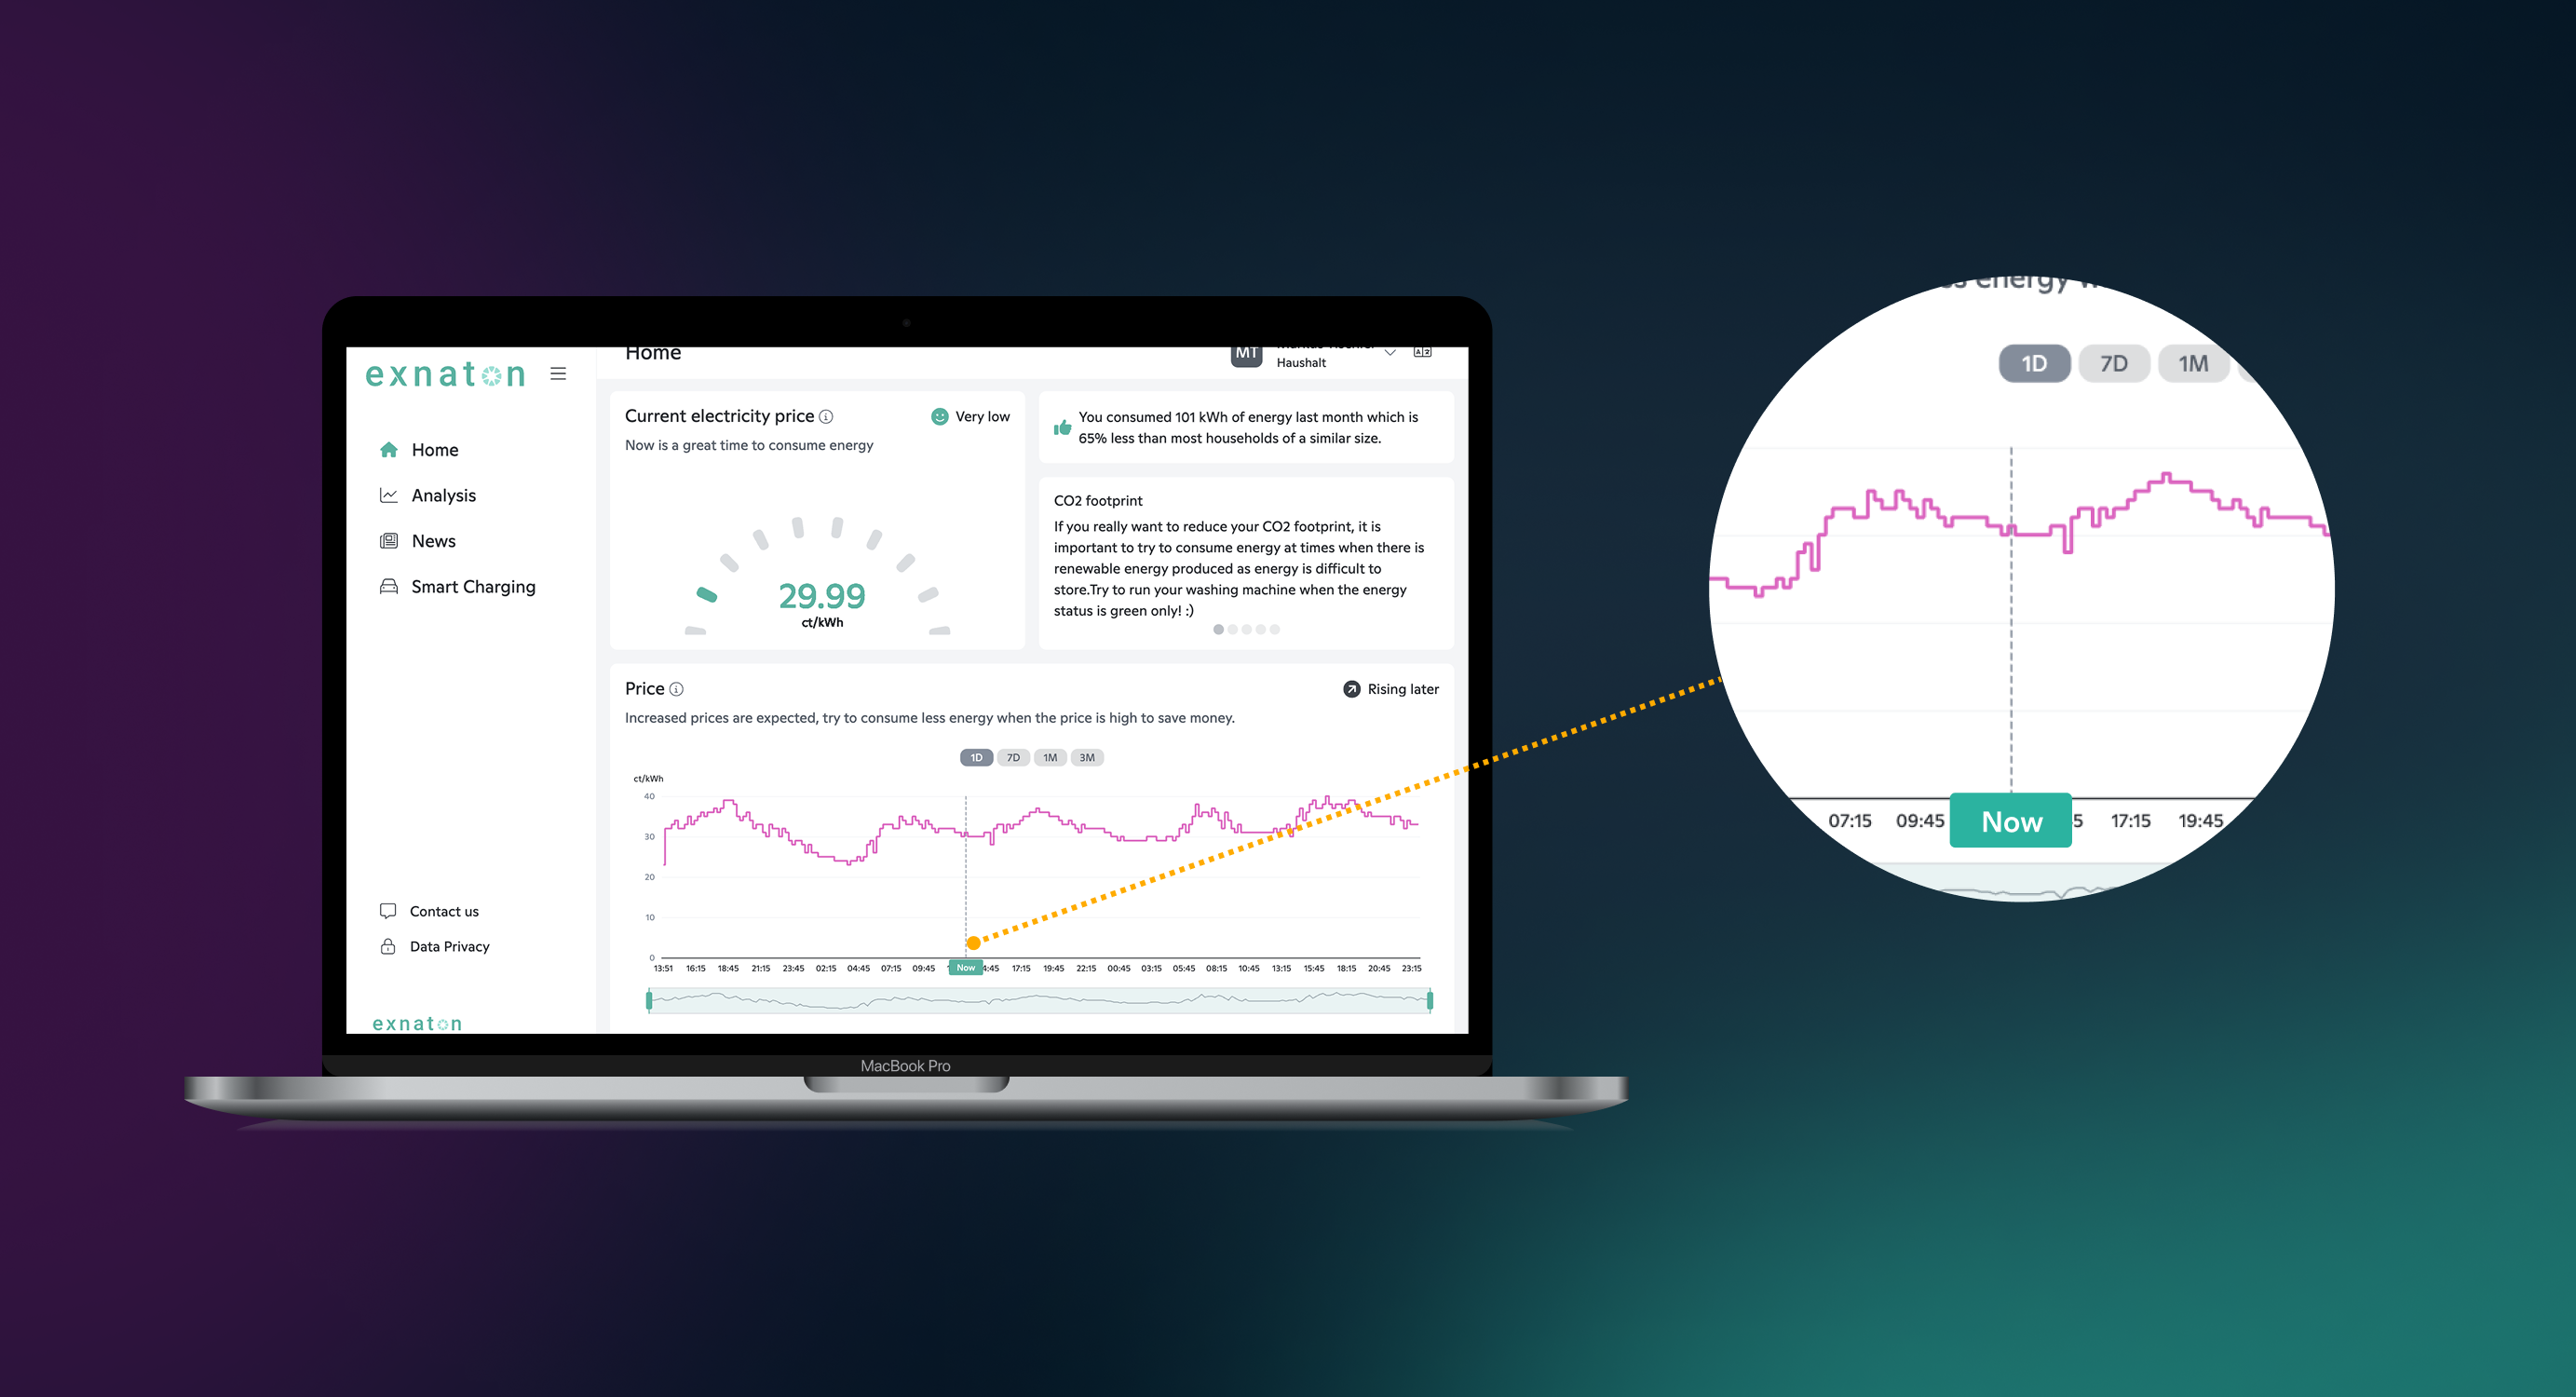
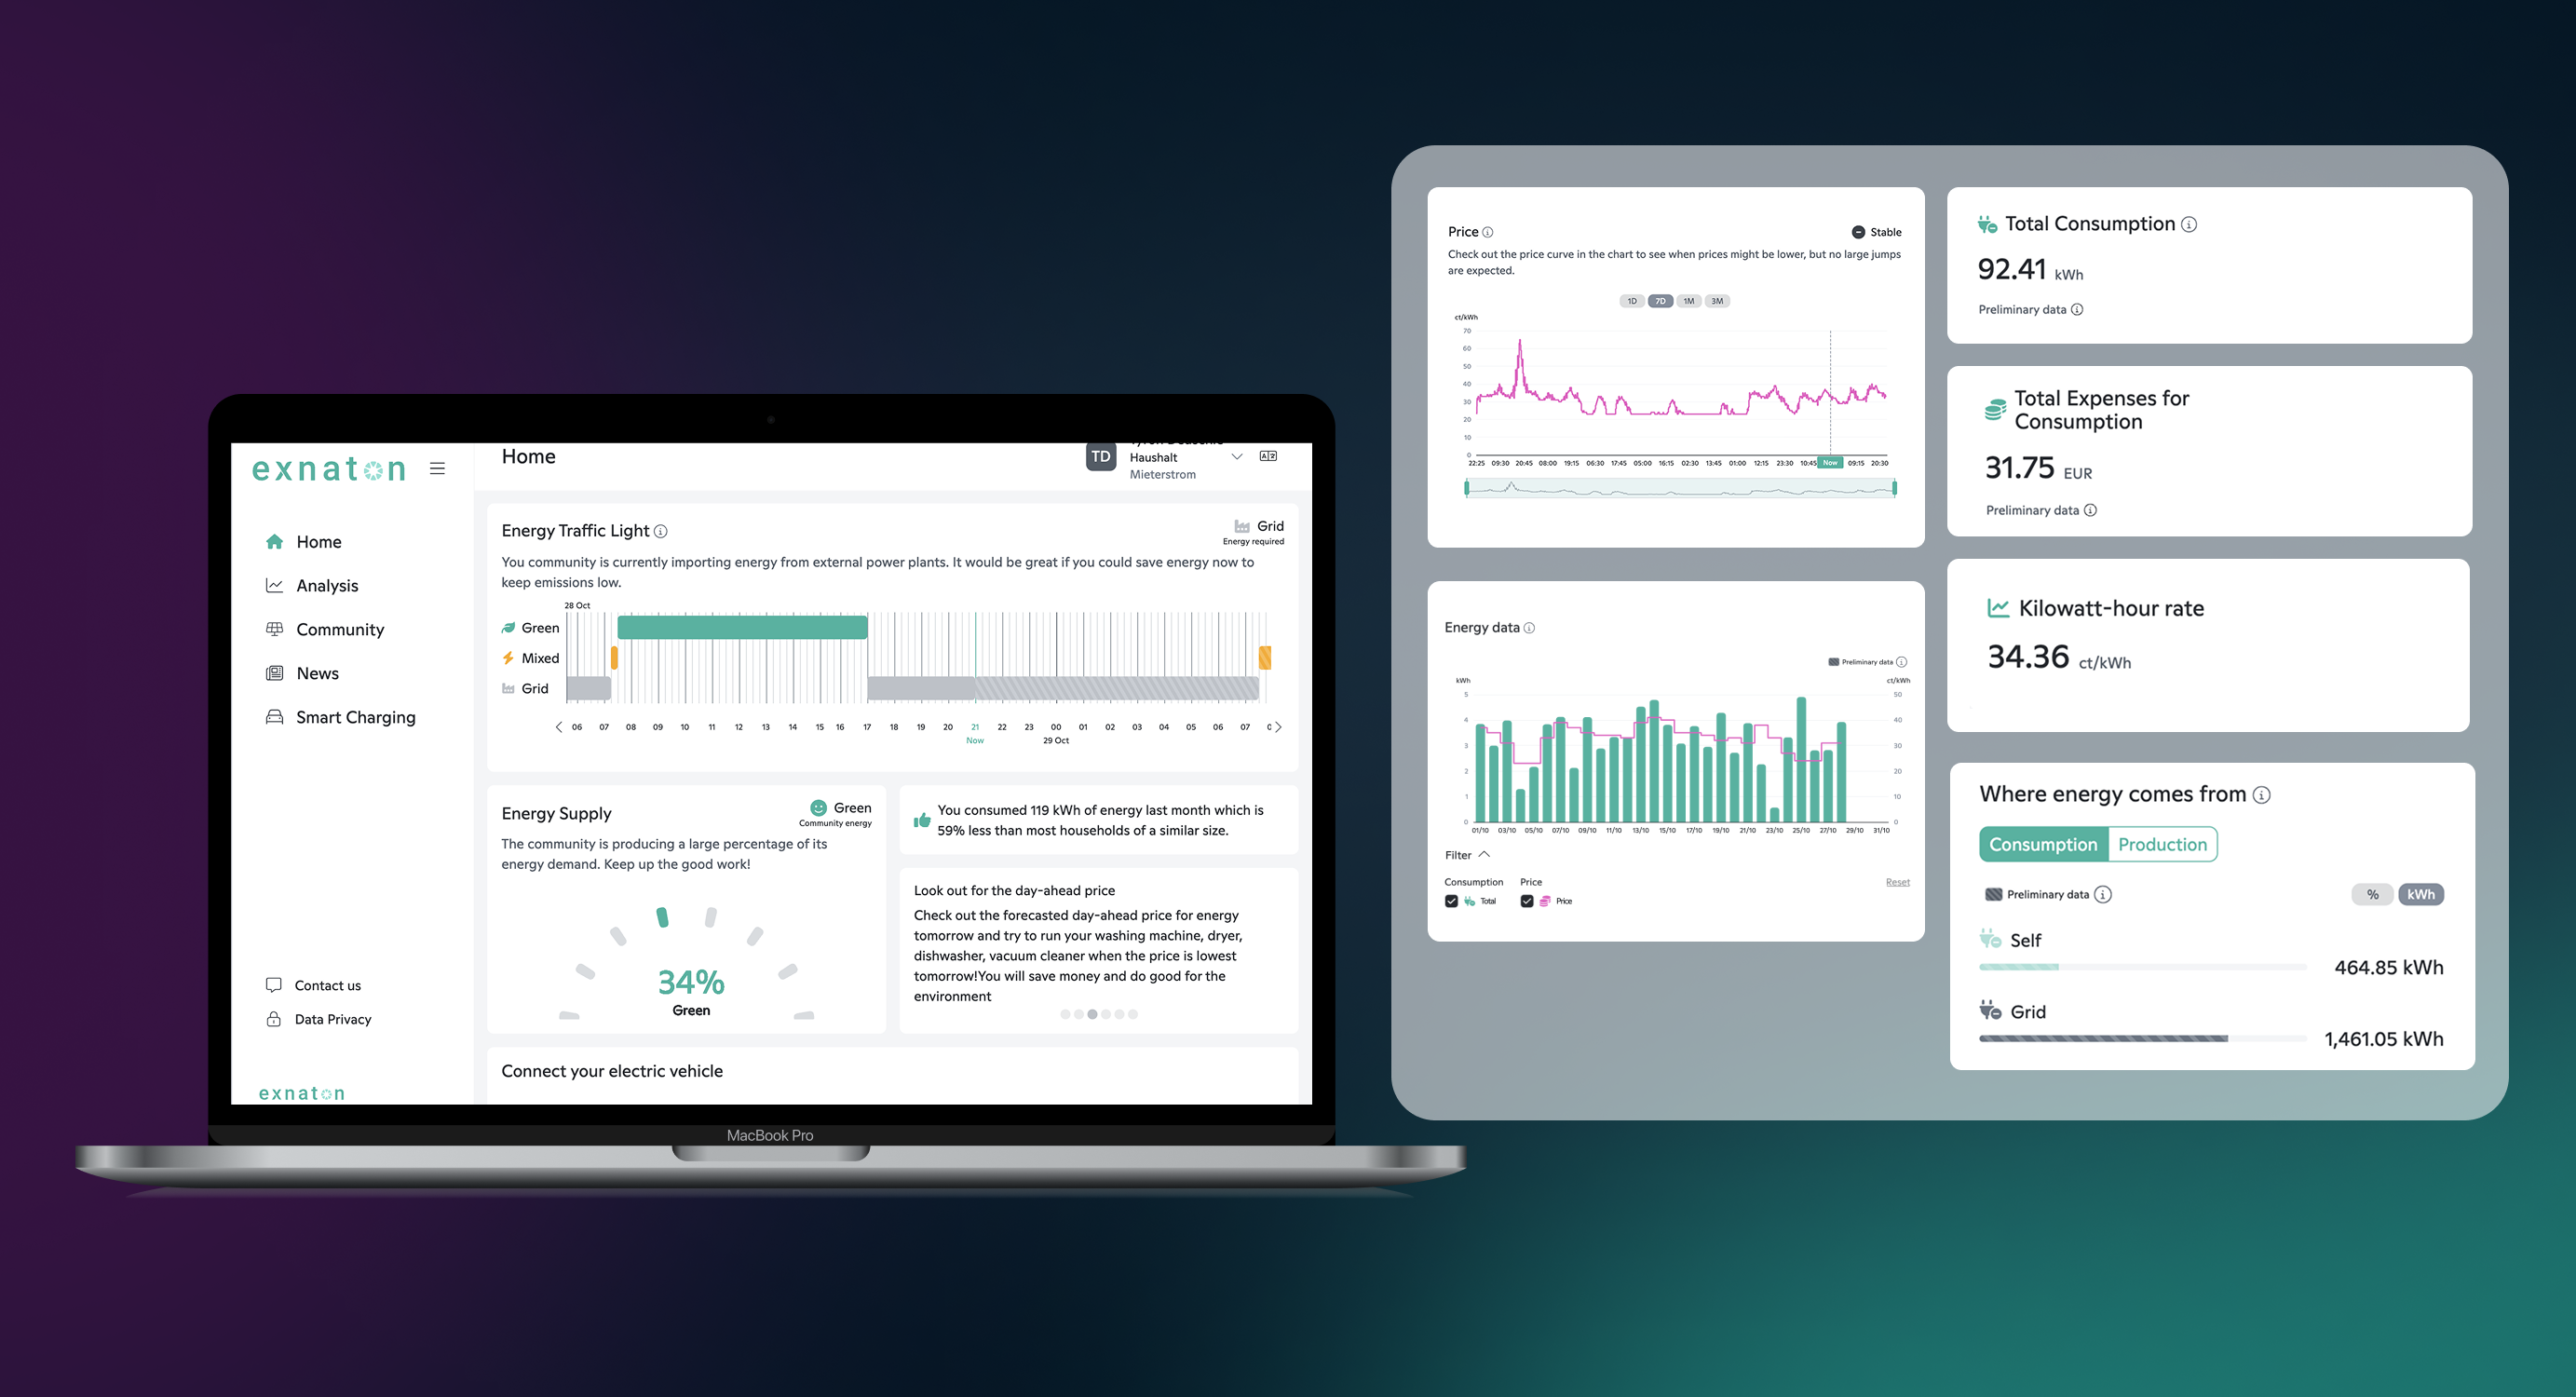
We’re improving the user experience and enabling smarter energy management with the introduction of real-time data visualization in exnaton.
Thanks to our integration with Smart Meter Gateway Administrator clouds, customers can now access near real-time energy data directly in their personal account.
These values are stored and displayed as non-billable preliminary data, which will later be replaced by the official metering data transmitted via energy market communication.
What users can expect
While these real-time values are typically not used for billing purposes, they significantly enhance user engagement and deepen understanding of personal energy behavior.
The analysis page displays real-time data clearly and intuitively — making energy usage visible almost at the moment it occurs.
Our Web Components — the “exnaton Molecules” — make it easier than ever to integrate exnaton’s energy features directly into existing customer portals.
If you already operate your own customer portal, these components allow you to seamlessly embed exnaton’s key functionalities — from energy charts and price insights to EV smart charging — without implementing a full white-label app.
We’ve recently released a series of improvements to make the Web Components and the end-user dashboard even more powerful and user-friendly.
These updates ensure a lean, flexible, and efficient integration experience, helping you deliver a modern, data-driven energy experience directly within your own customer portals.